
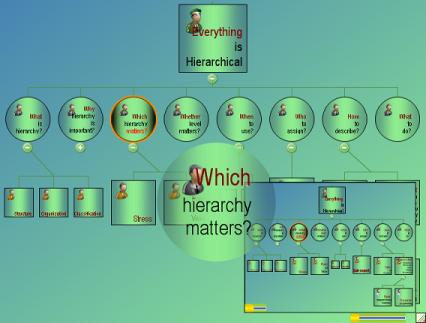
Hierarchy Chart
Because Everything is Hierarchical
The essential way to divide and conquer problems for desktop and web developers.
Visualize Complex Structures Instantly
Chart4.NET dynamically renders complex organizational data into beautiful, interactive, and easily readable maps. Connect nodes from your database, XML, or arrays seamlessly.
Dynamic Rendering
Auto-positioning algorithms ensure your charts are always perfectly balanced and spaced, regardless of data size.
Interactive Nodes
Drill down, expand, collapse, and utilize rich tooltips natively out-of-the-box for superior user experience.
Developer Friendly
Designed specifically for WinForms and ASP.NET. Integration is as simple as dropping the control on your form.
Understanding Hierarchy
A comprehensive guide on why hierarchical representation of data and facts is essential.
The hierarchy shows the relationship of various units. It is important in the design phase of a component or system. It shows:
- Structure: Hierarchy shows the inner-composition of an item or idea.
- Organization: It shows the components of an item and how they are bonded together.
- Classification: An item at the top shows the classification of items below it.
Usually, a hierarchy is represented by a chart. Common examples include Business, Photo, Company, City, Market, IT, Corporate, Human Resource, School, Financial, Team, Police, Hospital, and Sales Organization Charts. This long list itself tells us that everything can be hierarchical.
It classifies the items or components. Our knowledge is classified data. Using a hierarchy, we can change the way people think about a concept. A hierarchy conveys:
- Intention: It shows the intent of the total structure or concept.
- Knowledge: It describes knowledge; or knowledge comes from classification.
There may be more than one way to depict a system or concept. Consequently, the details and depth of the resulting hierarchy may vary. Mainly it depends on where the stress is and what is the point of view:
- Stress: Stress means what you want to convey about the item.
- Point of View: Refers to the angle you view the object. Functional and structural hierarchies are best examples. In a photo collection, you can have chronological or person (family) views.
This is an important fact that should be fine-tuned by considering the target audience. Normally there is no problem having more than one hierarchical representation, each describing a different stress or point of view.
When it is required to analyze or modify something - it gives a bird's-eye view of the problem. Use it when you want to quickly grasp the totality and to learn about it. Hierarchy analysis should be used for:
- System Analysis: Suppose you have a complex problem at hand and need to find the best solution. You have to split/componentize it in a hierarchical way, give a weight (cost estimation/resource estimation) for each node, and calculate the optimal solution based on the optimal weight.
- System Enhancements: When you need to modify or revolutionize an existing system, you need the existing structural and functional hierarchy to suggest modifications mapped to a new, better hierarchy.
There are two types of hierarchy charts to describe organizational structure:
Static Hierarchy Charts
Static charts can be created by diagramming tools (like Microsoft Visio) or drawing tools. The end point is that you save the chart drawn to an image file. Issues with static charts include:
- Static behavior: It cannot have dynamic (hyperlinking or interactive) behavior from a user point of view.
- Possibility of expiry: Static hierarchy charts may expire quickly when the underlying data changes. It is difficult to redraw them each time.
- Drawing effort: It is tedious to manually determine the size, font, and position of nodes.
Dynamic Hierarchy Charts
Dynamic charts have a programming scenario. Once used in a computer program or website, it provides the user with powerful features powered by live data (e.g., from a database). Advantages include:
- Dynamic behavior: They are interactive. Users can expand/collapse, zoom, see tooltips, and navigate to more details.
- Runtime Data (Data Independence): It takes live data from the source. The data can change irrespective of chart settings.
- Automatic drawing: It automatically computes layouts depending on the volume of data.
These advantages are provided by chart-specific features like resizability, rich tooltips, smart layouts, and automatic sub-charts. Unifosys Chart4.NET is a powerful dynamic charting component specifically designed for .NET web and desktop developers.
Not many options are available on whom to be assigned the charge (on a sub-hierarchy):
- Sub-expert: An expert on the subject of the sub-hierarchy is required. It will cause a better detailed design and execution.
Next time when you design/write/think of something, first think of its hierarchical organization and its position in a still larger hierarchy. Then you will have a full set of ideas. Now you may be doing the same, but probably without much thinking on that.
If you are a programmer, think of utilizing Unifosys Chart4.NET to provide runtime dynamic organization charts to your users.
More Demo for Organization Chart Component (ASP.NET)
Explore the various visual styles and interactive capabilities of our chart components.
Ready to build your own?
Download the completely free designer sample to test out features and customizations.